Thanks to our best-in-class Quality of Experience monitoring robots, we were able to monitor and really see if Google’s cloud gaming platform, Stadia, lives up to its expectations, in terms of quality of experience. Read on to discover our full analysis.
Introduction & Setup
The environment for this Snapshot consisted of several Witbe “Video & Media” robots hosted on Witbe Cloud in 3 cities across North America and Europe: Montreal, New York, and Paris.
Every robot setup complied with Stadia’s bandwidth requirements of an internet connection speed of at least ten megabits per second (Mbps). According to Stadia’s internet connection speed test, our robot in Montreal, New York, and Paris had a download speed of 100 Mbps, 85 Mbps, and 450 Mbps — respectively.
We chose the popular game “Assassin’s Creed Odyssey” for this QoE monitoring scenario.
We measured and verified the following KPIs:
- Availability: percentage of sessions for which the Stadia platform was accessible.
- Login: percentage of sessions for which login was successful.
- Login time: time between the robot clicking on the login button (after credentials were input) and it being logged-in.
- Game Availability: percentage of sessions for which the game successfully started.
- Game launch time: time between the robot launching the game on the Stadia platform and the game starting.
- Playability: percentage of sessions for which clicking “resume” (i.e., play) in the main menu of the game successfully started the game’s intro scene.
- Witbe VQ-MOS Score: a score representing the video quality of the first 30 seconds of the game, measured with our Video Quality Mean Opinion Score (VQ-MOS) algorithm.
- Witbe Smartping Latency: Stadia’s network latency measured by our Smartping algorithm. It also gives us information about packet loss rate, and network speed stability.
The KPIs were measured automatically in each city every 30 minutes over a 2-day period, from June 10th to 11th, for a total of more than 295 sessions. Every session included a 30 seconds Witbe VQ-MOS analysis, representing more than 10 000 KPIs measured!
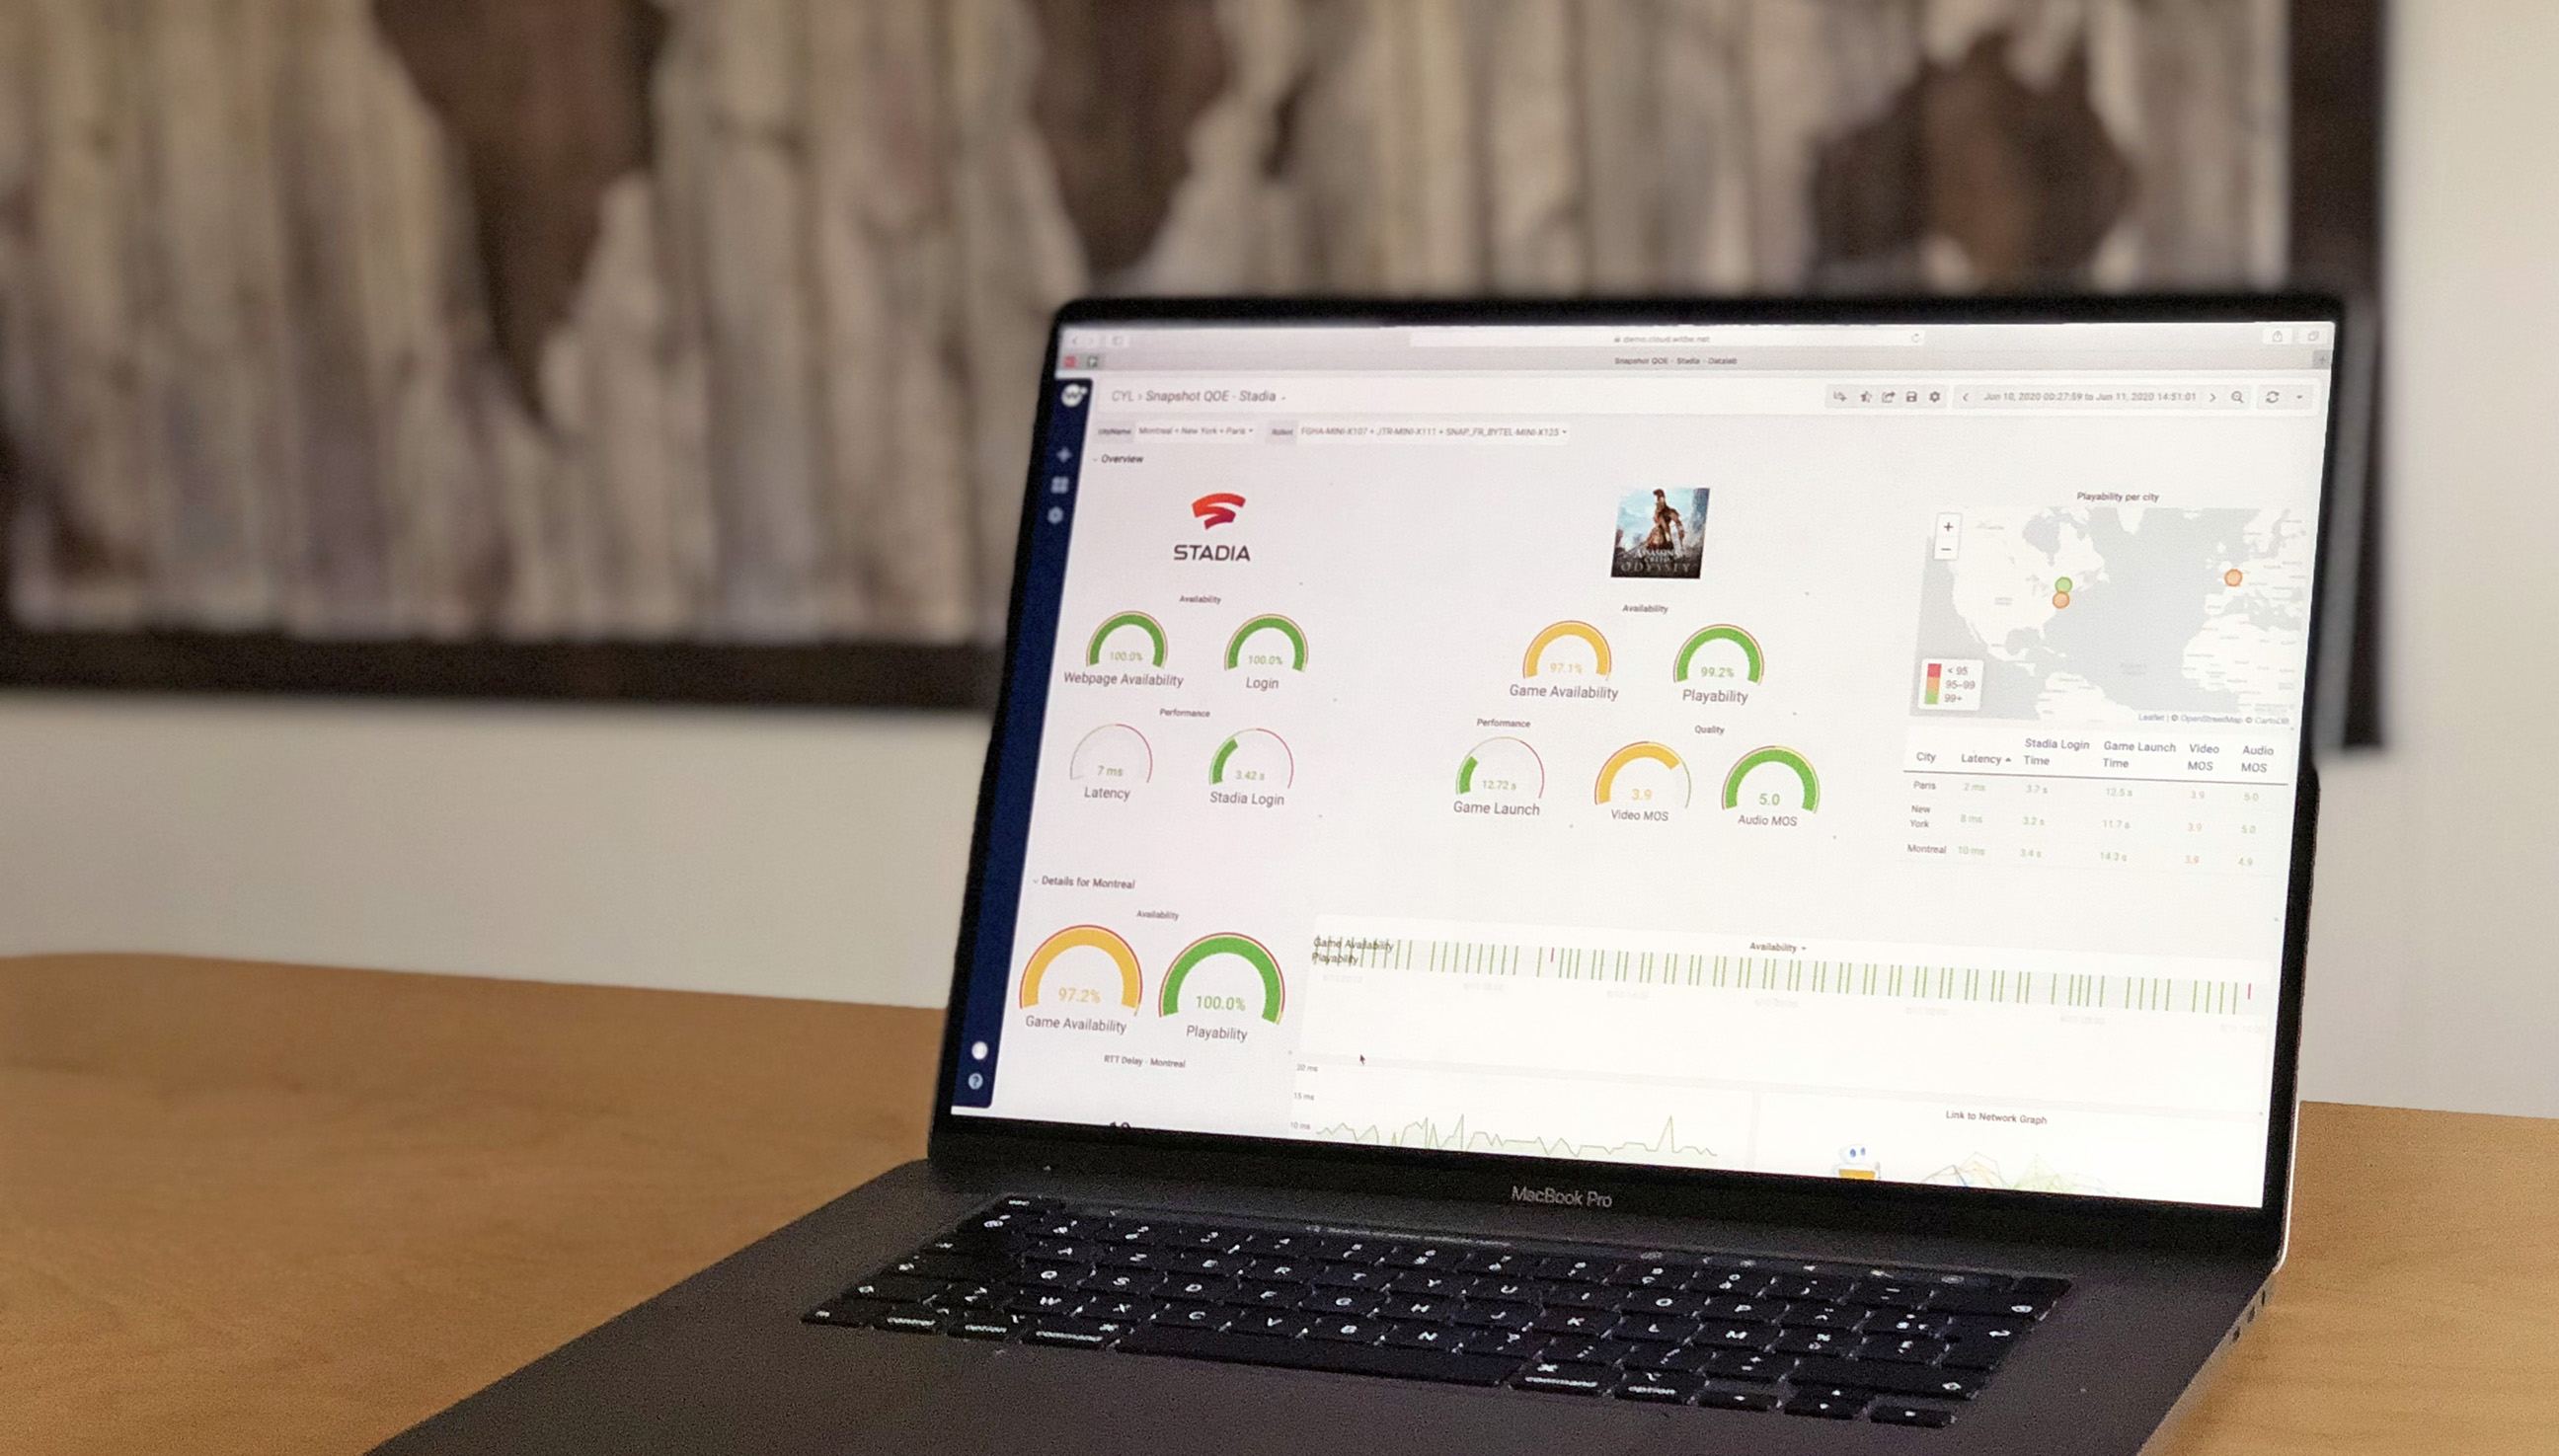
All graphs and other visual representations of KPIs in this QoE Snapshot are generated with Witbe Datalab, our restitution interface for fault finding, root cause analysis, and advanced analytics.
Global Overview
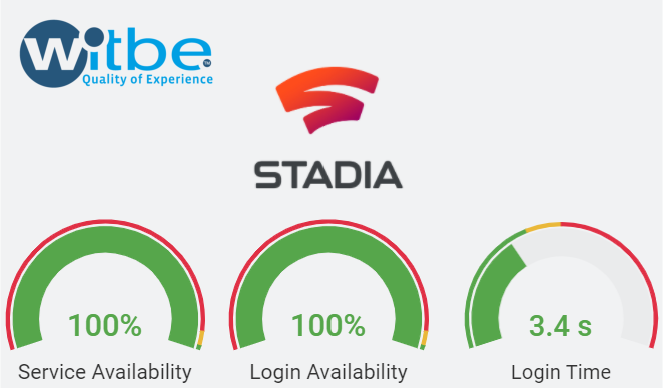
By looking at the measured KPIs, we can see that the Stadia platform itself offered a perfect performance in every location, with 100% Service Availability and Login Availability, and a median Login Time of no more than 3.42s. Based on our experience, we consider this to be a very good Login time, and stellar Service Availability.
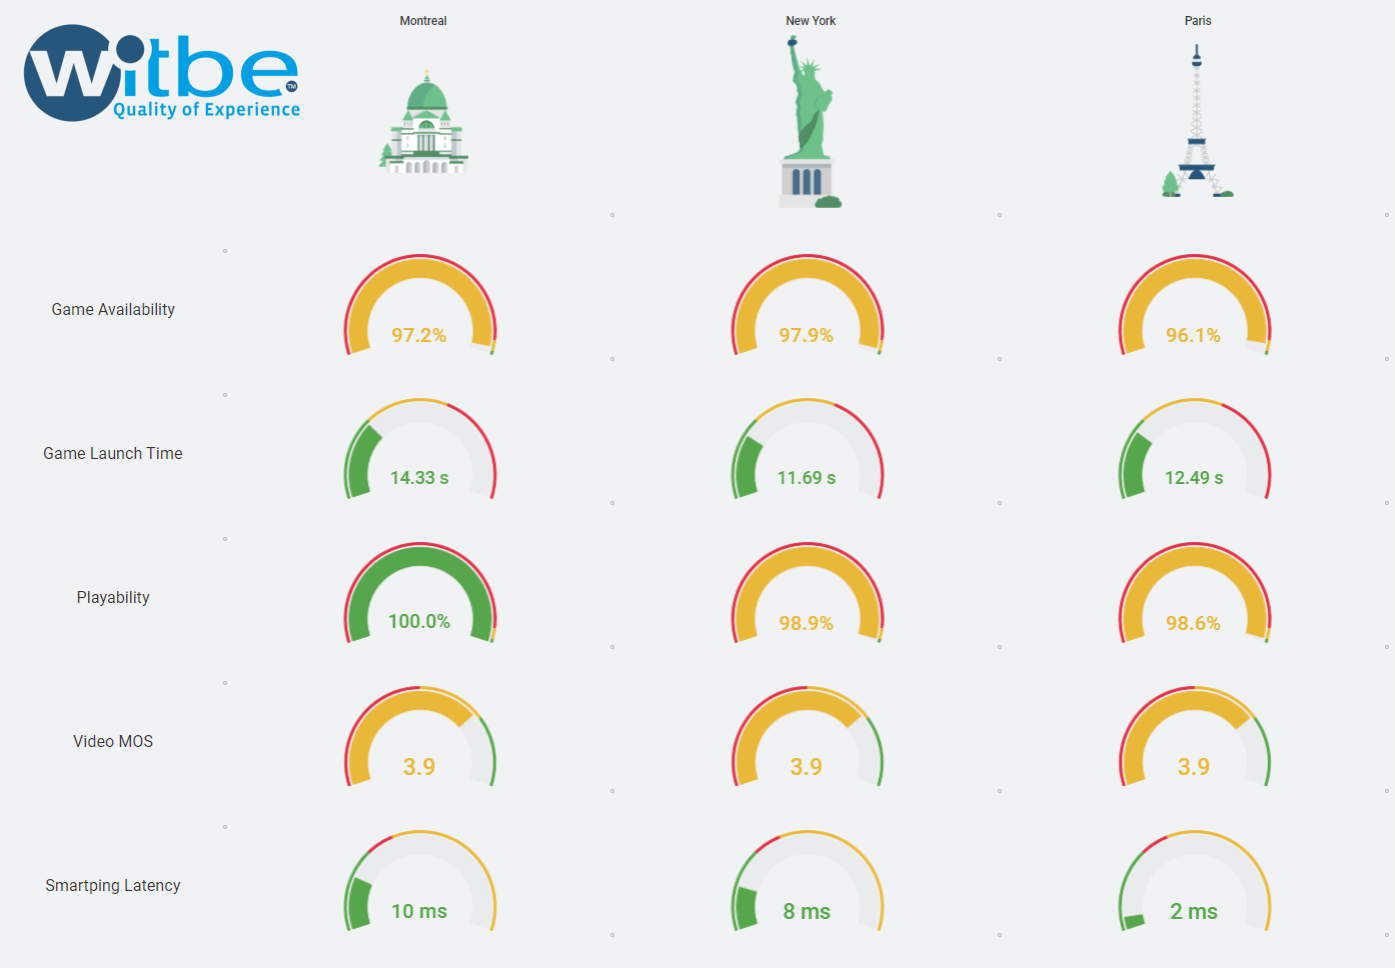
By comparing the game-related KPIs in each city, we can see that they’re very homogenous with similar median Game Availability rate, Playability rate, Game Launch Time, and VQ-MOS Score in every location.
Considering KPIs like Stadia’s Game Launch Time, we can see that they offer a good overall quality of experience. Indeed, compared to other services, Stadia game launch time is relatively fast and stable.
On the subject of performance, while conducting a Smartping analysis, we also observed very low latency in every location — especially in Paris, which benefited from a fiber connection with a connection speed of 450 Mbps.
Witbe Smartping is a non-intrusive algorithm that can map a delivery chain and pinpoint bottleneck, even in unmanaged networks. This patented technology allows to visualize the network routes taken for services delivery, allowing easier troubleshooting and enforcement of Service Level Agreements with third parties.
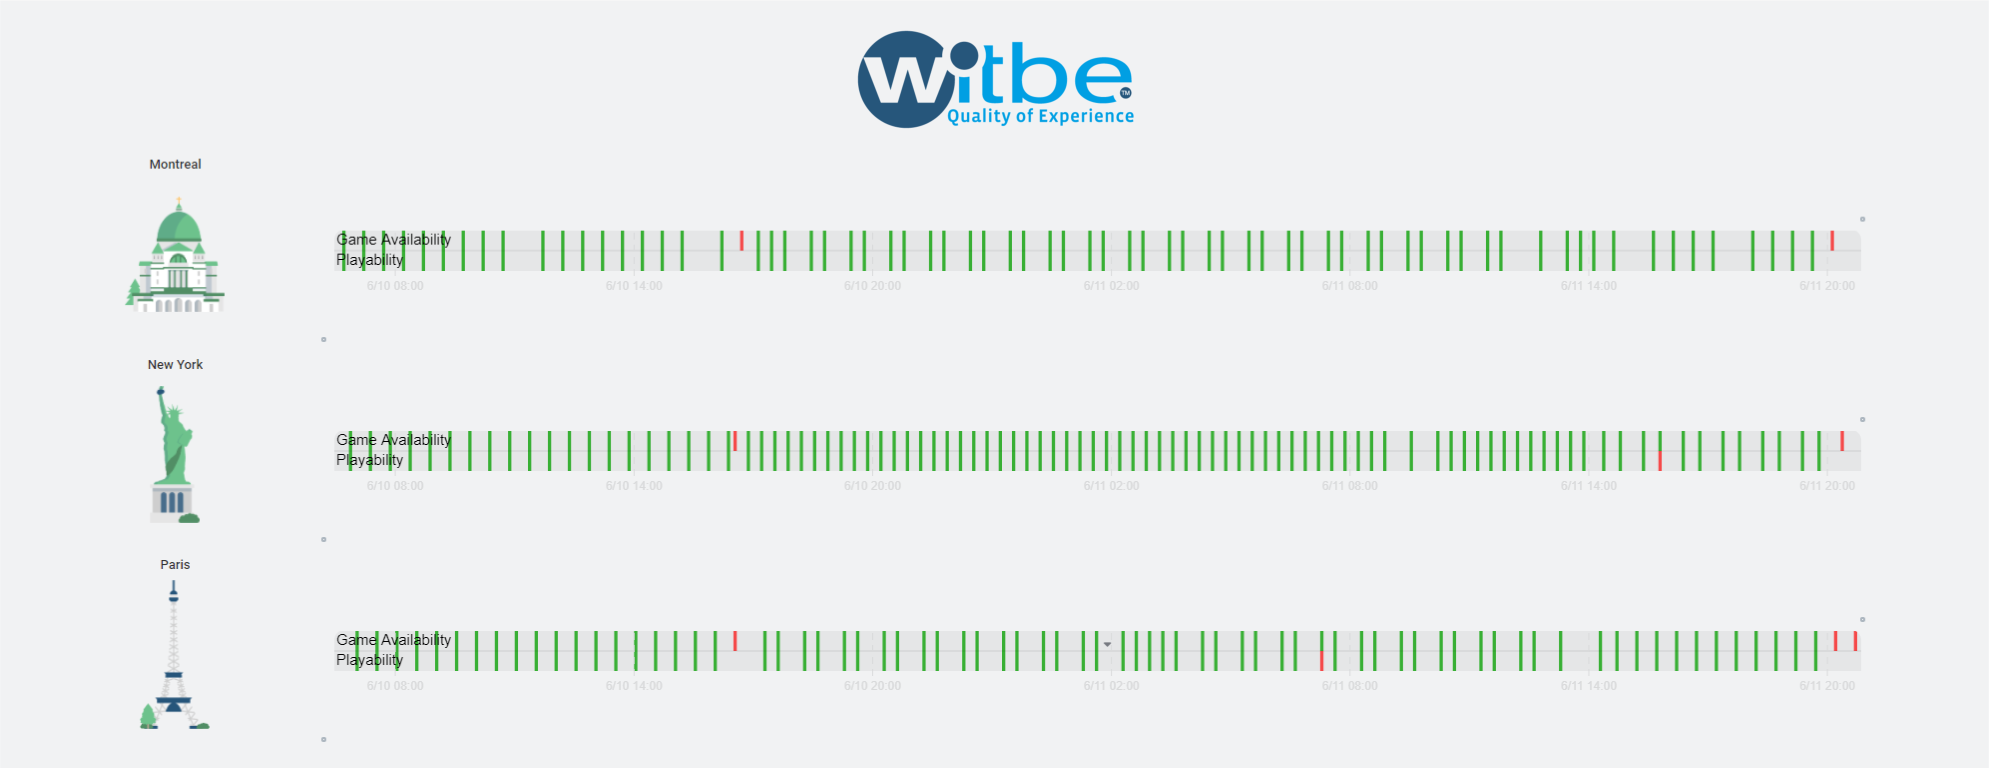
Overall, Stadia users in North America and Europe appear to benefit from a good and constant Quality of Experience. But with measurements under 100% for Game Availability and Playability, and as the graph above shows, we did encounter some game crashes, service degradations, and other incidents that we are now going to investigate.
Availability issues and game crashes
The video above shows one of the sessions where the game crashed right after launch; the incident was detected by the robot in Montreal at 4:40 pm CET on June 10th. Witbe Robots record video traces for every session, to replay the scenario and understand what the robot measured — this video was re-encoded and compressed
The same incident of the game crashing at launch was also raised in Paris and New York at approximately the same time, hinting at a platform-wide service degradation.
It is interesting to note that when looking at gaming statistics from popular gaming platform Steam, we can see that 4:30 pm to 5 pm is peak hour. We could speculate that this service degradation was due to network congestions.
The video above shows another example of a crash, this time during the introduction of the game. Traditional factors for in-game crashes, such as inadequate hardware or out-of-date graphic drivers, are very unlikely in a cloud gaming service like Stadia. It is most probable that these types of incidents are due to dropped connections.
As mentioned earlier, we observed a very low latency on the Stadia platform. These various examples of crashes show that availability issues can arise even when network KPIs seem good. It goes to show that the only way to measure the true QoE delivered to your customers is to monitor a service in conditions closest to the end-users’.
Availability is the most important KPI for any service provider; promises of cloud gaming in HDR at 60 frames per second with 4K resolution and a great selection of games mean nothing if the games cannot be launched successfully. Users not being able to play their favorite games will be very frustrated, which may lead to a high chance of customer turnover.
Profile degradation


Every session included a 30 seconds Witbe VQ-MOS analysis during the intro scene of the game. Because the intro scene is always the same, it allows us to compare the same frame’s graphic quality in two different sessions. The two images above are encoded in PNG without loss and uploaded on this page without further compression.
Witbe VQ-MOS is a ten-year R&D effort in psycho-acoustic and psycho-visual analysis of video streams. It works without referential or previous knowledge of the video, and in real-time. It is based on three main artifacts: jerkiness, blurriness, and blockiness.
This example of graphic quality degradation is something we are very used to seeing due to our OTT monitoring expertise. Because cloud gaming streams a video feed to the user, it uses the same techniques as video streaming services. In this case, the stream switched to a lower quality profile. This technique is used by video streaming services to sacrifice video quality to avoid rebuffering; in cloud gaming, it is to prioritize low latency and avoid any input delays.
Conclusion
Nine months after launch, we can say that Stadia’s overall Quality of Experience is satisfactory. Even though the users can still experience availability issues and game crashes, Google’s cloud gaming platform offers a smooth experience.
Other major companies are throwing their hat in the cloud gaming ring, with services like Microsoft’s Project xCloud and Sony’s Playstation Now launching this fall. This new type of interactive service will require very stable and fast internet connections, and customers’ expectations of very low input latency could create serious issues for any unprepared operators!
Just as it is crucial to monitor video streaming services, and as cloud gaming grows in popularity, we believe it will be essential to monitor these services and ensure an excellent Quality of Experience over different networks like fiber, WIFI, and 5G.
For more details about the results of this QoE Snapshot, don’t hesitate to contact us!
See you soon for the next Witbe QoE Snapshot!
About Witbe QoE Snapshots
In the same way that a consumer report tests a product and publishes an analysis of its overall quality, the Witbe QoE Snapshots test digital services to make available to the market information on the true Quality of Experience delivered internationally. These QoE Snapshots should not serve as benchmarks or as rankings of operators by service or device. Instead, the goal of these QoE Snapshots is to provide a global overview of digital services with multiple configurations and in various environments. Thus, the public will be able to better understand the technological complexity inherent to today’s services, like the distribution of video content. It is quite a technical feat – considering the efforts and means implemented – to broadcast videos on different devices and networks, with a quality that is acceptable by consumers with high expectations.
Since its origin, Witbe relies on a non-intrusive technology, based on Robots measuring the quality truly delivered. The Witbe Robots are placed at the edge of distribution and connected to test devices, the same ones as those used by real users. The Robots measure the Quality of Experience truly delivered to the end-users by providing KPIs on the service’s availability, performance, and integrity.
Each Snapshot is composed of several analytical frames, highlighting interesting findings about the KPIs that were measured. In our last QoE Snapshot, we compared channel change KPIs for video operators in North America and Europe. This time, we are publishing a look at the quality of experience of Google’s cloud gaming platform: Stadia.