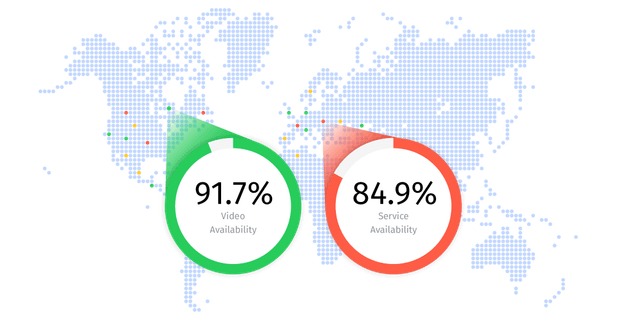
TheWitboxautomaticallystreamsyourdataintoSmartgate,unlockingdetailedreportsthathighlightactionableKPIsfrom everymarket.

  • Instant alerts and insights to detect and resolve issues in real time

  • Shared dashboards with recordings for faster, collaborative troubleshooting

  • Multi-level reports tailored to each use case, showing only the KPIs that matter

  • Web-based and fully integrated with direct live stream access from reports

Instant, actionable, detailed, and organized data? Yes, please!

You can't fix what you can't see!

Four levels of analytics to optimize
your video services effortlessly.

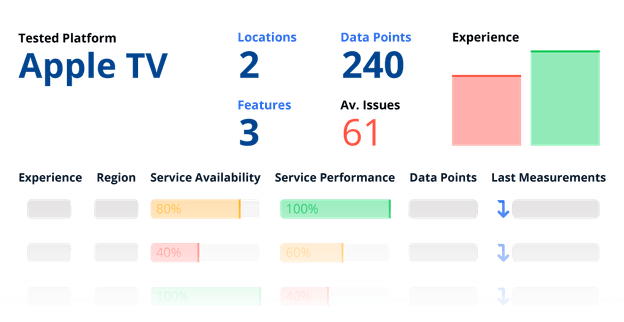
Level 1 report: Overview & Status

  • Get a global overview of all monitoring sessions
  • Check the status across the platform, device type, location, and service
  • Use dynamic filters to focus your analysis
  • Drill down in one click to identify the cause and effect of any reported issue
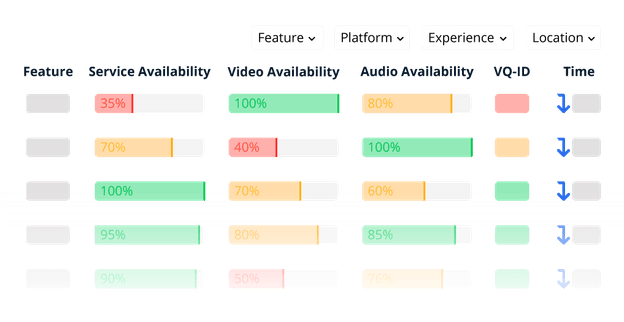
Level 2 report: Analyze From a Fixed Angle

Lock the analysis on a specific angle, such as:

  • Location
  • Platform
  • Channel
  • User experience

and explore how performance varies across the others.

By freezing the data on one angle, Smartgate’s dashboards allow you to easily compare trends, identify discrepancies, and uncover opportunities for improvement across your monitored services.

Level 3 report: Scenario Runs List

For any selected scenario:

  • Access the full list of all monitoring runs in just one click
  • Deep dive into every test run [data point]
  • Quickly identify sessions that presented issues

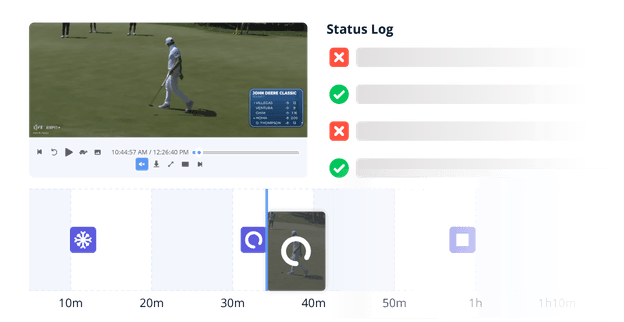
Level 4 report: KPI Deep Dive & Video Evidence

Explore every detail captured during your tests.

Level 4 provides granular access to all:

  • Measured KPIs
  • Video recordings of the sessions
  • Detailed scenario logs

It's your go-to for verifying results, auditing performance, and supporting data-driven decisions.

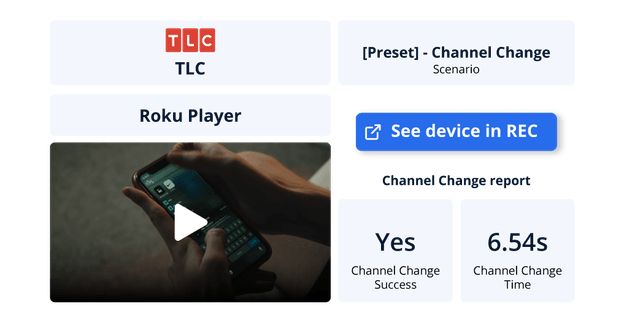
Access device live stream

Interconnectivity between Smartgate and the REC.

  • Click “See device in the REC”
  • Access the device live stream
  • Verify instantly if the issue persists

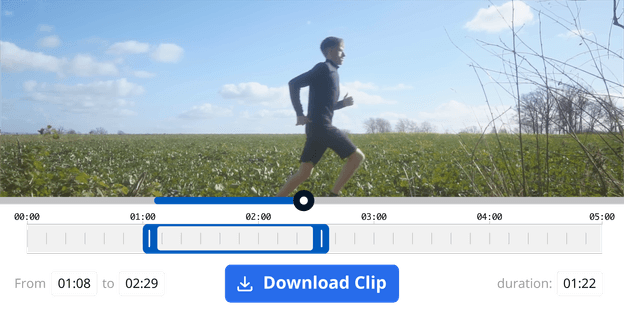
Record video clip

No guessing, everyone sees the same evidence.

  • Select the exact time frame of the error
  • Create clip recording
  • Easily share it with your team or partners

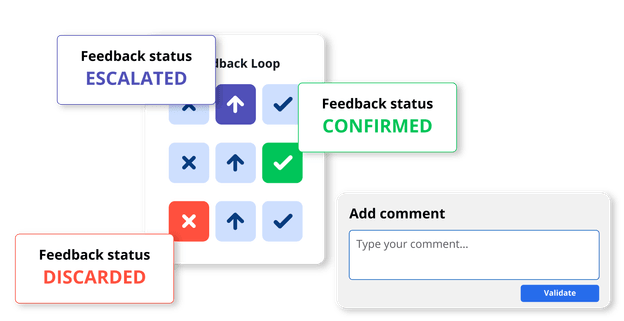
Feedback loop

Assess, save and share your error analysis.

  • Discard if it was not an error
  • Escalate if it needs immediate attention
  • Confirm if it is a real error

Frequently asked questions

  • How long my data will be stored and available?

    Storage duration depends on the databin priority level assigned to each trace:

    • High Priority: Traces are kept indefinitely, unless the 50% storage cap on the High bin is reached. In that case, new traces that match the High rule are downgraded to the Medium bin.
    • Medium Priority: Stores error and inconclusive traces. By default, keeps at least 90 days of history until the robot reaches 90% capacity, and 30 days if it reaches 95%.
    • Low Priority: Stores successful and development runs. Retains 15 days of traces by default, dropping to 7 days at 90% capacity, and 5 days at 95%.

    Retention rules can also be customized by filtering on KPIs, context, or scenario metadata.

  • Is my data stored in a secure location?

    Yes. All traces are stored locally on the Witbox, which acts as the storage point for the databins. Each databin (High, Medium, Low) has isolated storage control, and traces are automatically routed and retained according to your configured policies.

    For extra security assurance, you can contact your CSM to confirm storage compliance with your data protection standards.

  • Who can access my data?

    Access to stored data is managed via Witbe’s access control layers and your organization’s user permissions.

    Typically:

    • Only authorized users within your organization who have access to the Web REC interface or Resource Manager can view, manage, or download traces.
    • Granular access can be further defined using user roles and account-level permissions.
  • Is usage data collected?

    Yes. Usage and storage metrics are collected and made visible:

    • Each Witbox tracks databin occupation and storage health
    • Three KPIs are available to monitor databin usage:
      • databinLevelTarget: the intended priority level
      • databinLevelCurrent: the actual storage location
      • databinReason: why a trace ended up in that bin

    These help you monitor retention behavior and fine-tune storage policies.

  • How can I share the data?

    You can share and download specific trace files directly from the Datalab dashboard.
    The traces are stored by databin and date, ensuring structured access.

Witbe icon