QoE vs data usage benchmark
Compare video quality and data consumption across apps, networks, and devices.
How it works in 3 steps

Monitor to balance data usage and QoE
Witbe’s technology measures how each app consumes data on real Android and iOS devices across Wi-Fi and multiple cellular networks.
In Smartgate, you can:
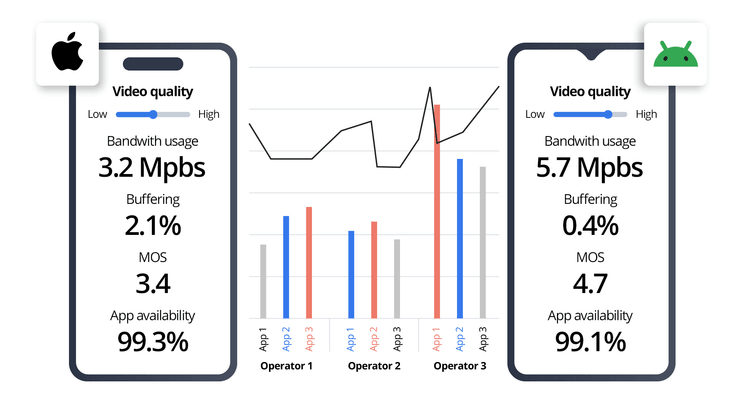
- Compare throughput and data usage per application and network.
- Correlate data consumption with QoE metrics such as startup time, buffering, and VQ-MOS.
- Identify where bandwidth reductions affect user perception, and where they don’t.
This benchmark empowers teams toc make informed decisions about bitrate ladders, throttling, and adaptive-bitrate tuning while keeping video quality consistent.

Comprehensive multi-variable benchmarking
Witbe’s benchmark is designed to reflect real-world diversity, not lab simulations.
Tests can be run across different apps, networks, devices, and data plans, capturing how quality and efficiency vary in every environment.
Whether comparing OTT, social, or operator-branded services, measure thousands of real video sessions to highlight patterns across:
- Network conditions – Wi-Fi, 4G, 5G, or fixed broadband
- Device ecosystems – Android, iOS, tablets, or set-top boxes
- Service types – short-form, live, or on-demand content
The result: a scalable, flexible benchmarking framework that adapts to your market, helping you understand network data usage and app video quality on every network and platform.

Detailed KPIs and metrics for benchmarking
Capture a wide range of Quality-of-Experience and network indicators, including:
- Throughput and bitrate stability – to assess bandwidth efficiency.
- Startup time and rebuffering ratio – to measure playback responsiveness.
- VQ-MOS and VQ-ID (clean-video-per-minute) – to evaluate perceived video quality.
- Data consumed per session or per minute – for cost and sustainability analysis.
- Blockiness, blurriness, and jerkiness scores – for visual accuracy.
- Availability and app sanity checks – to confirm stability and service readiness.
- Network KPIs (Android) – RSSI, RSRP, RSRQ, CQI, RSSNR, and other radio metrics for correlation with video performance.
These KPIs are consolidated into easy-to-read dashboards that make it simple to track performance over time, compare networks, and share results across teams.

From measurement to insight
All results are consolidated into a single, visual workspace where teams can interpret performance and act on it quickly.
Every test includes synchronized video evidence, giving operations and product teams a direct view of what users actually experienced.
- Identify where bandwidth savings impact quality and where they don’t.
- Compare your service with peers to validate performance and strategy.
- Share clear, visual evidence across technical, product, and executive teams.
This data unlocks a common language between operations, engineering, and management; turning complex QoE and data metrics into actionable decisions that improve efficiency.

Proof-based insights for every team
Every playback session is recorded on real devices, capturing subtle playback issues such as micro-buffering, blurriness, or short freezes that backend analytics often miss.
This proof-based approach provides verifiable evidence to guide technical decisions, vendor discussions, and management reporting.
For app providers, it validates new releases, helps optimize adaptive bitrate ladders, avoid more throttling and benchmarks playback and ad performance across competitors.
For mobile operators, it quantifies the impact of throttling or traffic shaping on QoE, identifies high-consumption app and network combinations, supports sustainability goals by reducing unnecessary bandwidth and energy use and avoid exponentially increasing infrastructure endlessly.

Mobile testing powered by the video mobile automation
Witbe’s Video Mobile Automation (VMA) is the hardware used to test and monitor real Android and iOS phones under real network conditions, without complex setup.
Each unit is compact, rackable, and fully pre-assembled for quick installation in a lab, office or datacenter.
Technical highlights:
- Supports two smartphones (Android and/or iOS) connected simultaneously.
- Ships fully pre-assembled with power, Ethernet cables and mobile mounts
- Features adjustable mounts and smart calibration tools to align screen position and lighting for consistent results.
- Built for 24/7 operation, making it suitable for continuous or comparative benchmarking campaigns.
The VMA makes it effortless for teams to scale testing across regions or campaigns and ensure results truly reflect what mobile users experience.
Learn more in the dedicated video mobile automation use-case page.
Key advantages
-
Minimize throttling
Understand the trade-off between delivering high-quality video and managing data usage.
-
Optimize performance
Identify areas where you can reduce bandwidth consumption without harming QoE.
-
Competitive benchmarking
Compare industry peers to ensure high-quality and efficient data usage while minimizing infrastructure development or throttling at the network level.
Frequently asked questions
-
What is the QoE vs data usage benchmark?
It is Witbe’s methodology for measuring the Quality of Experience delivered to end users and comparing it to the amount of data consumed during playback sessions, allowing you to find the right balance between quality and efficiency
-
Why is it important to measure both QoE and data usage for app providers?
High QoE sometimes requires more bandwidth, but excessive data usage can trigger throttling and therefore network performance, and user satisfaction. Measuring both allows you to optimize delivery without sacrificing quality.
-
Can it compare my service with competitors?
Yes. Witbe can run identical tests on your service and on competitors under the same conditions to create objective, side-by-side benchmarks.
-
Which devices and networks are supported?
Tests can run on smartphones, tablets, Smart TVs, and STBs over Wi-Fi, 4G, 5G, fiber, and DSL networks.
-
Can it measure across data plans?
Yes. The benchmark includes Starter, Basic, and Premium plans to reflect real user conditions.
-
How quickly are results available?
Reports are generated immediately after the tests, with real-time alerts possible for critical QoE degradations.